


Rapid Attribution of August 2025 Extreme Heat in China: Anthropogenic Influence in the Middle-Lower Yangtze and Tibetan Plateau
On September 6, 2025, the Beijing Climate Center released a rapid attribution analysis of extreme high-temperature events across China’s seven climate regions during August 2025. The main findings are summarized below.
Observational data (Fig. 1) show that the August mean temperatures in the Middle-Lower Yangtze River Valley and the Tibetan Plateau were 2.16 °C and 1.93 °C above the 1961–1990 baseline average, exceeding the mean by 2.8 and 3.7 standard deviations, respectively. These values rank as the third and fourth highest since instrumental records began. In North China, Northwest China, Southwest China, Northeast China, and South China, monthly mean temperatures were 1.70 °C, 1.31 °C, 0.71 °C, 1.14 °C, and 0.61 °C above normal (exceeding the mean by 2.7, 2.5, 1.6, 1.4, and 1.5 standard deviations), ranking ninth, tenth, fourteenth, sixteenth, and sixteenth in their historical records.
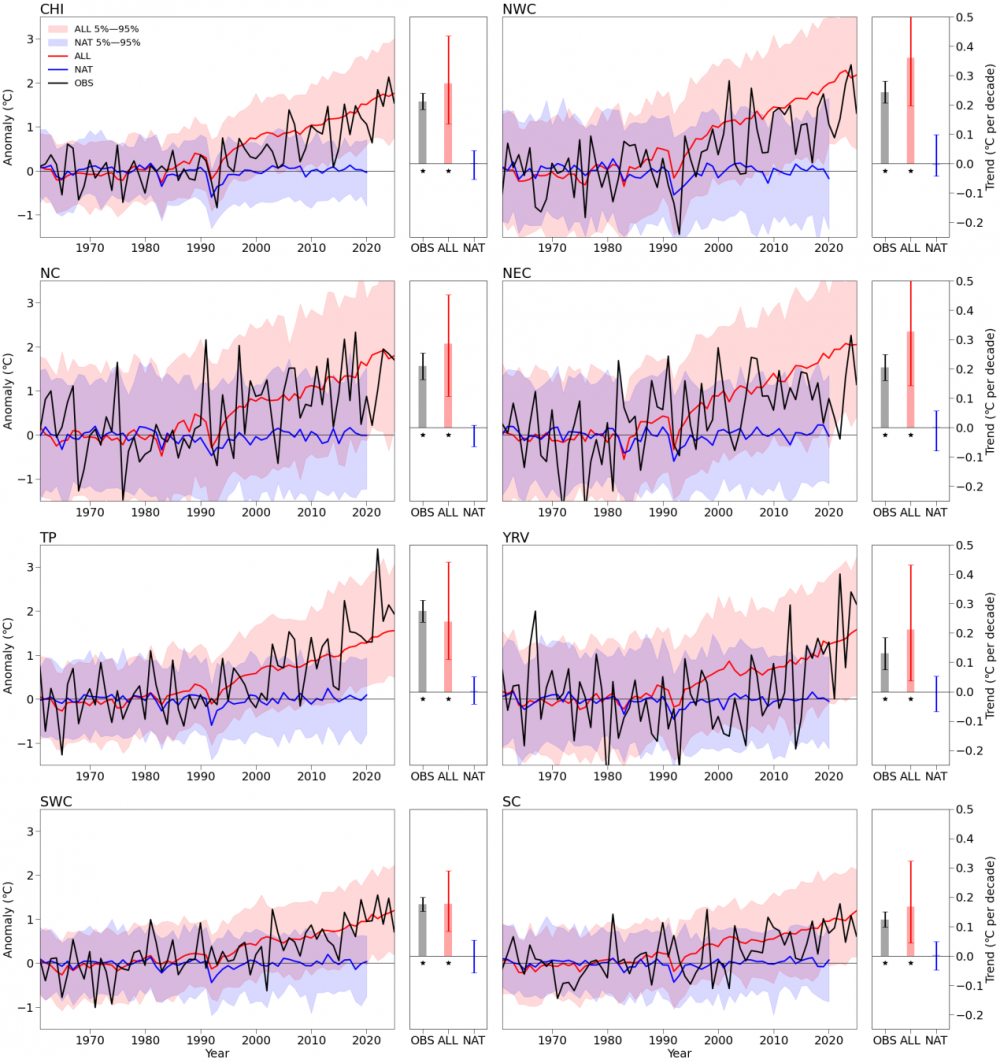
Fig. 1. Left: Observed (OBS) and CMIP6-simulated (ALL: all-forcing experiment, NAT: natural forcing only) August mean temperature anomalies (relative to 1961–1990, in °C) from 1961 to 2025 for China and its seven climate regions. Shading indicates the 5%–95% range of the multi-model ensemble. Right: Corresponding warming trends (in °C/decade). An asterisk (*) indicates a trend significant at p < 0.05; vertical lines denote the 5%–95% confidence intervals.
Region abbreviations: CHI: China, NWC: Northwest China, NC: North China, NEC: Northeast China, TP: Tibetan Plateau, YRV: Middle-Lower Yangtze River Valley, SWC: Southwest China, SC: South China.
Attribution analysis based on CMIP6 models (Figs. 1, 2) indicates that, in the absence of anthropogenic forcing, an extreme high-temperature event comparable to that over the Tibetan Plateau would have been highly improbable. Under the current climate state (2020–2030), human activities have increased the probability of an August 2025-like extreme high-temperature event in the Middle-Lower Yangtze River Valley by a factor of 12.7 (90% confidence interval: 11.2–14.5). By contrast, high temperatures in North China, Northwest China, Southwest China, Northeast China, and South China were close to the current climatological mean. In these regions, anthropogenic warming was partially offset by natural variability, leading to less pronounced extremity. Without human influence, the heat intensity in these regions would have been substantially lower.
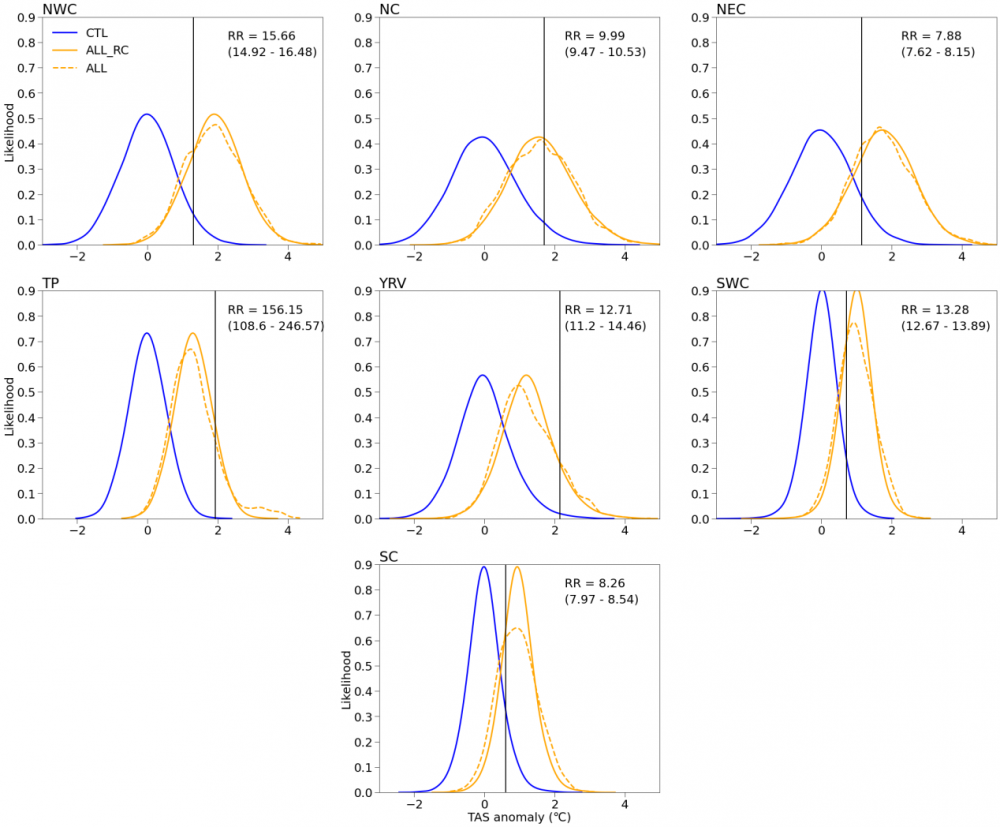
Fig. 2. Influence of human activities on the probability of August 2025 high-temperature events across China’s seven climate regions. Solid blue and orange lines represent the probability distributions under the current climate (2020-2030, 11-year window centered on 2025) for the pre-industrial control (CTL) experiments and reconstructed ALL distribution by combining the adjusted anthropogenic forcing response with the unforced internal variability (ALL_RC), respectively. The orange dashed line indicates the probability distributions for all-forcing (ALL) experiments. Vertical lines mark the August 2025 event thresholds, with annotations showing the risk ratio (RR) of human influence and its 5%–95% confidence interval.
Under the medium emissions scenario (SSP2-4.5), CMIP6 projections (Fig. 3) suggest a substantial future increase in the probability of extreme high-temperature events similar to those in the Middle-Lower Yangtze River Valley and the Tibetan Plateau. By the 2050s, the return periods for such extreme heat are projected to shorten to 2.0 years and 1.5 years, respectively. In North China, Northwest China, Southwest China, Northeast China, and South China, similar high-temperature events are expected to become commonplace, with return periods of 1.1–1.3 years.
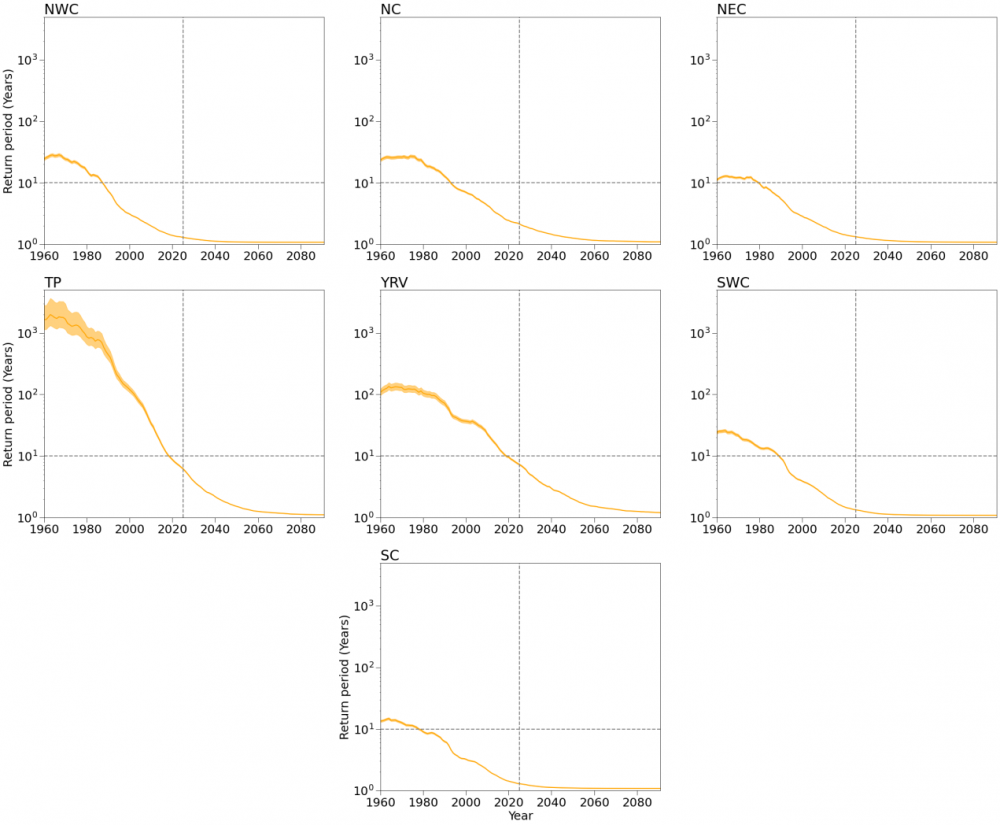
Fig. 3. Evolution of the return period for August 2025-like high-temperature events from 1961 to 2100 across China's seven climate regions. Shading indicates the 5%–95% confidence intervals.
These results were obtained using the rapid attribution prototype for extreme high temperature developed by the Key Innovation Team on Climate Change Detection and Response of the China Meteorological Administration. The prototype employs a CMIP6-based response correction attribution method, integrating model outputs and observational data through preprocessing and model pre-evaluation to establish an optimized operational framework suitable for rapid attribution.
For further details, please refer to: Advances in Climate Change Research
(https://www.sciencedirect.com/science/journal/16749278)