



Rapid Attribution of June 2026 Temperature Anomalies in China: Substantial Anthropogenic Influence in Northwest China
Rapid Attribution of June 2026 Temperature Anomalies in China: Substantial Anthropogenic Influence in Northwest China
On July 6, 2026, the Beijing Climate Center (National Climate Centre of China) released a rapid attribution analysis of the June 2026 temperature anomalies observed across China's seven climate regions. The key findings—covering observations, attribution analysis, and future projections—are summarized below.
Observations
Observational data (Fig. 1) show that China's June mean temperature was 1.1°C (2.9 standard deviations) above the 1961–1990 baseline average. Northwest China registered an anomaly of 2.7°C (4.4 s.d.) – the second highest June temperature on record for this region, behind only June 2025. June mean temperature anomalies in South China, the Tibetan Plateau, and Southwest China were 0.8°C (1.4 s.d.), 1.0°C (1.8 s.d.), and 0.6°C (1.1 s.d.), ranking 16th, 21st, and 23rd historically, respectively. The Middle–Lower Yangtze River Valley, Northeast China, and North China saw mean temperature anomalies of 0.3°C, 0.0°C, and –0.2°C relative to the baseline, none of which ranked among the top 30 warmest Junes on record.
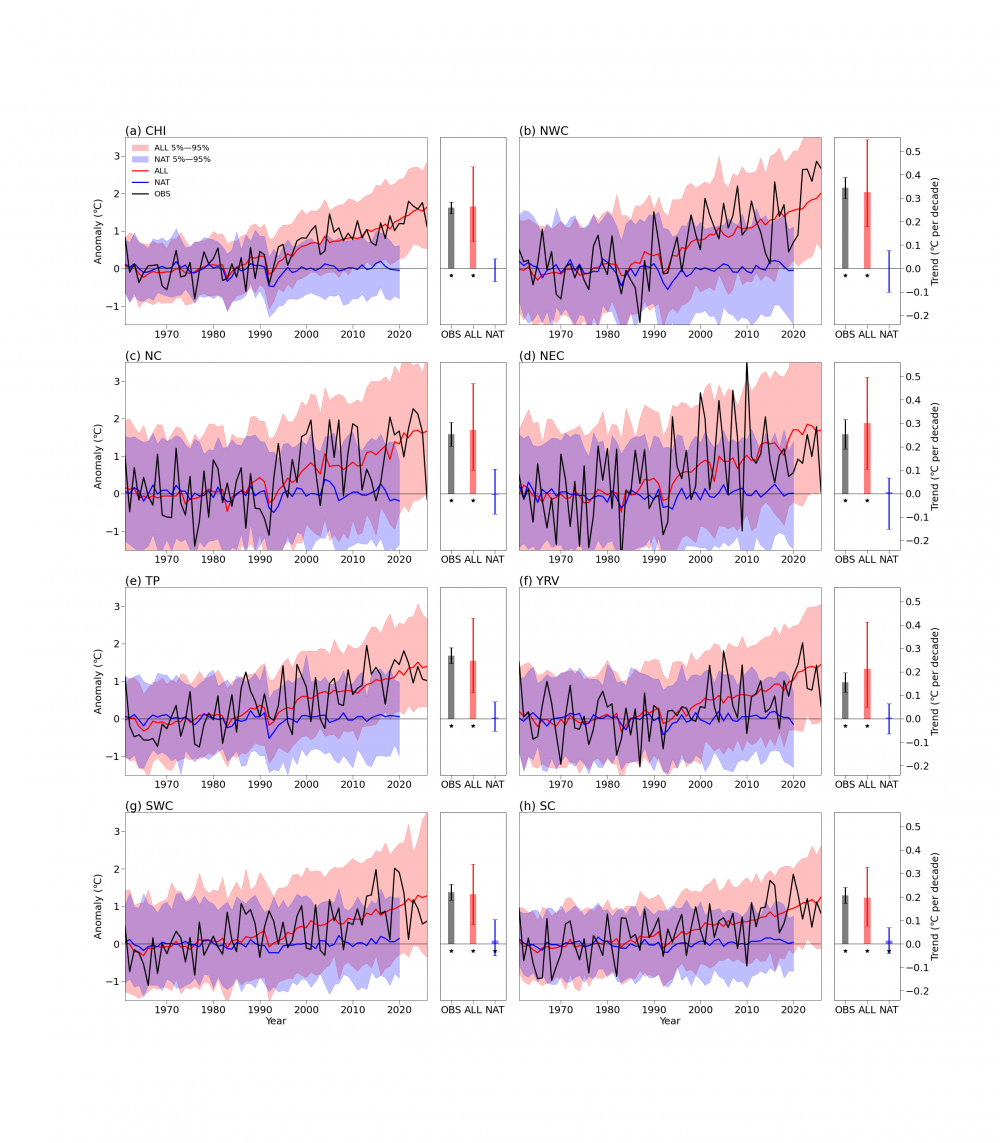
Figure 1. Left: Observed (OBS) and CMIP6-simulated (ALL: all-forcing experiment; NAT: natural-forcing only) June mean temperature anomalies (relative to 1961–1990, in °C) from 1961 to 2026 for China and its seven climate regions. Shading indicates the 5%–95% range of the multi-model ensemble. Right: Corresponding warming trends (in °C/decade). An asterisk (*) indicates a trend significant at p < 0.05; vertical lines denote the 5%–95% confidence intervals. Region abbreviations: CHI: China, NWC: Northwest China, NC: North China, NEC: Northeast China, TP: Tibetan Plateau, YRV: Middle–Lower Yangtze River Valley, SWC: Southwest China, SC: South China.
Attribution Analysis
Attribution analysis based on CMIP6 models (Figs. 1 & 2) indicates that, under the current climate background, human activities have increased China's June mean temperature by 1.4°C (90% confidence interval: 1.0–1.8°C; same below) and have increased the probability of 2026 like warm anomalies in Northwest China by a factor of 42 (36–51). For South China, the Tibetan Plateau, and Southwest China, anthropogenic forcing contributed 1.1 (0.8–1.4)°C, 1.2 (0.9–1.5)°C, and 1.1 (0.8–1.4)°C of warming, respectively. Without human influence, the mean temperature anomalies for these regions relative to the 1961–1990 baseline would have been –0.3 (0.0 to –0.6)°C, –0.2 (0.1 to –0.5)°C, and –0.5 (–0.2 to –0.8)°C, respectively. For the Middle–Lower Yangtze River Valley, Northeast China, and North China, human activities contributed 1.2 (0.9–1.6)°C, 1.4 (1.1–1.8)°C, and 1.4 (1.0–1.8)°C of warming, respectively; without anthropogenic forcing, these regions would have been cooler than the baseline by 0.9 (0.6–1.3)°C, 1.4 (1.0–1.8)°C, and 1.6 (1.2–2.0)°C. These results suggest that internal climate variability in June 2026 substantially offset anthropogenic warming, leading to near baseline or even lower actual temperatures in Northeast and North China; without human influence, temperatures in these regions would have been markedly below the baseline.
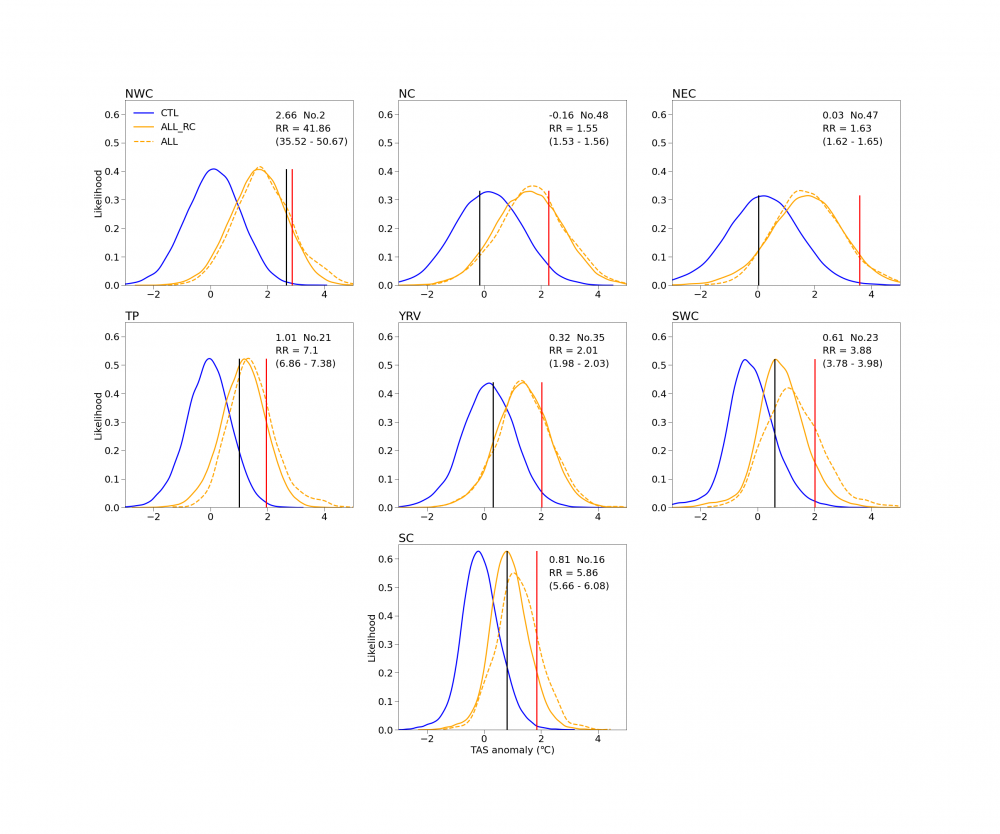
Figure 2. Influence of human activities on the probability of June 2026 high-temperature anomalies across China's seven climate regions. Solid blue and orange lines represent the probability distributions under the current climate (2021–2031, 11-year window centered on 2026) for the pre-industrial control (CTL) experiments and reconstructed ALL distribution obtained by combining the adjusted anthropogenic forcing response with unforced internal variability, respectively. The orange dashed line indicates the probability distributions for the all-forcing (ALL) experiments. Vertical lines mark thresholds for the June 2026 event (black) and the record breaking event (red). Upper right labels show event intensity, historical ranking, risk ratio (RR) of human influence, and its 5%–95% confidence intervals (from 1000 Bootstrap resamples).
Future Projections
Under the medium emissions scenario (SSP2-4.5), CMIP6 coupled model projections (Fig. 3) indicate that over the next 5–10 years (2031–2036), the probability of June 2026 like anomalously warm conditions in Northwest China will increase substantially, with a return period of 5.0 (4.9–5.1) years. For record breaking June high-temperature events across the seven climate regions, the projected return periods are 6.7 (6.6–6.9) years (Northwest China), 2.9 (2.8–2.9) years (North China), 8.9 (8.6–9.1) years (Northeast China), 4.4 (4.3–4.5) years (Tibetan Plateau), 3.4 (3.3–3.5) years (Middle–Lower Yangtze River Valley), 8.3 (8.1–8.6) years (Southwest China), and 8.2 (7.9–8.4) years (South China).
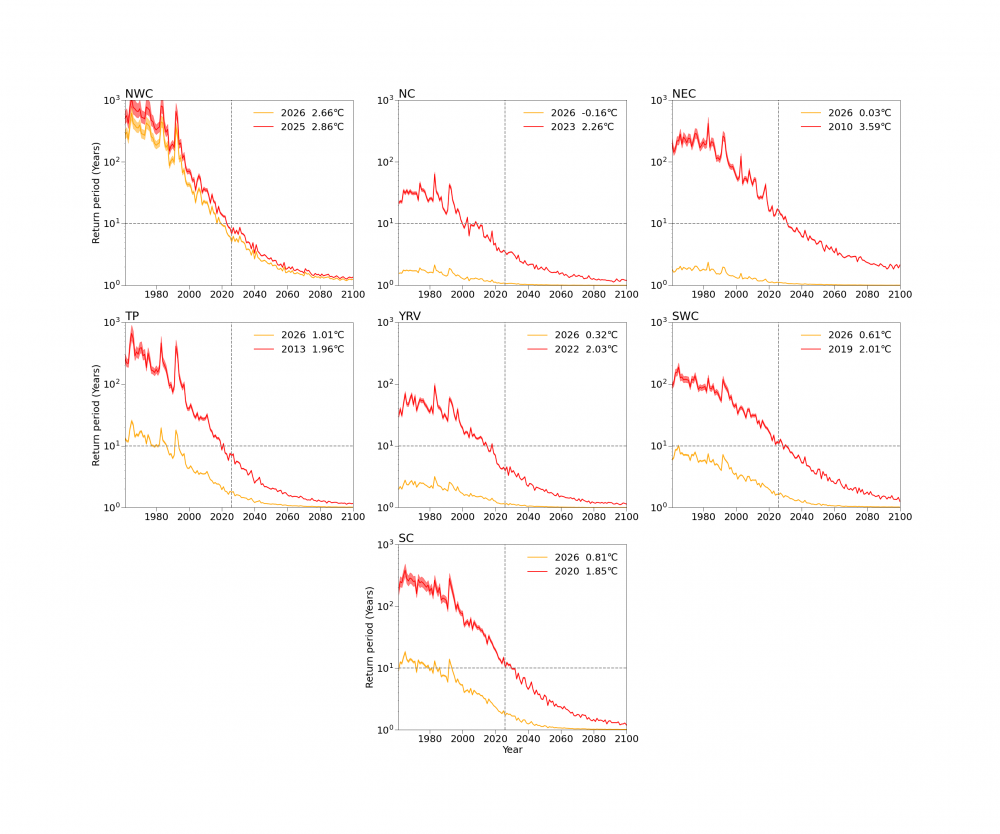
Figure 3. Return period changes for June high-temperature events in China's seven climate regions from 1961 to 2100. Orange and red solid lines denote 2026-like high-temperature events and record breaking events, respectively; shading indicates 5%–95% confidence intervals (from 1000 Bootstrap resamples). Upper right labels show event year and intensity.
Methodology
These results were obtained using the rapid attribution prototype for extreme high temperature developed by the NationalClimate Centre. The prototype employs a CMIP6-based response adjusted attribution method, integrating model output and observational data through preprocessing and model pre-evaluation to establish an optimized operational framework suitable for rapid attribution.
For further details, please refer to: Advances in Climate Change Research
(https://www.sciencedirect.com/science/journal/16749278)