


Rapid Attribution of July 2026 China Heat: Anthropogenic Warming Raises Likelihood of Extremes and Shortens Near-term Return Periods
On 6 August 2026, the Beijing Climate Center (National Climate Centre of China) released a rapid attribution analysis of the July 2026 temperature anomalies observed across China’s seven climate regions. The main findings—covering observations, attribution, and future projections—are summarized below.
Observations
Observational data (Figs. 1 & 2) show that China’s July mean temperature was 2.0°C above the 1961–1990 baseline. Northwest China and the Tibetan Plateau experienced the most pronounced warming, with anomalies of 3.2°C and 2.1°C (5.7 and 4.5 standard deviations, respectively)—both setting new record highs since instrumental records began. In North China, Northeast China, and the Middle–Lower Yangtze River Valley, July mean anomalies were 2.1°C (3.5 s.d.), 2.0°C (3.1 s.d.), and 1.4°C (1.8 s.d.), ranking as the 4th, 6th, and 8th warmest Julys on record, respectively. Southwest China and South China saw modest anomalies of 0.5°C and 0.2°C, ranking 21st and 35th historically.
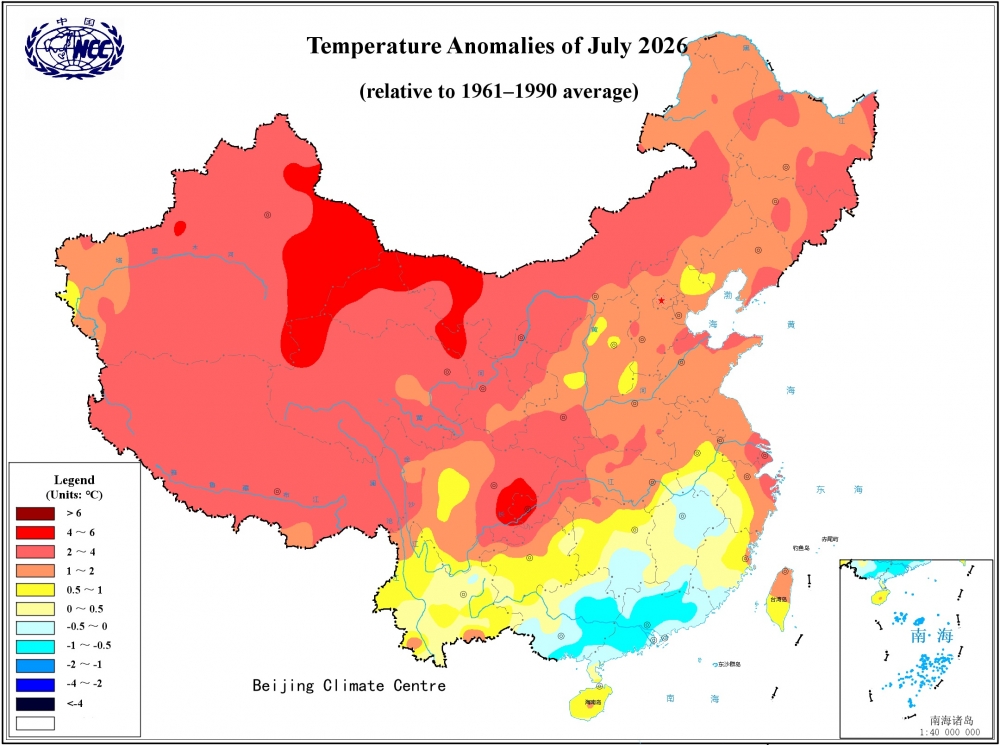
Figure 1. Distribution of July 2026 mean temperature anomalies (relative to 1961–1990 average; °C).
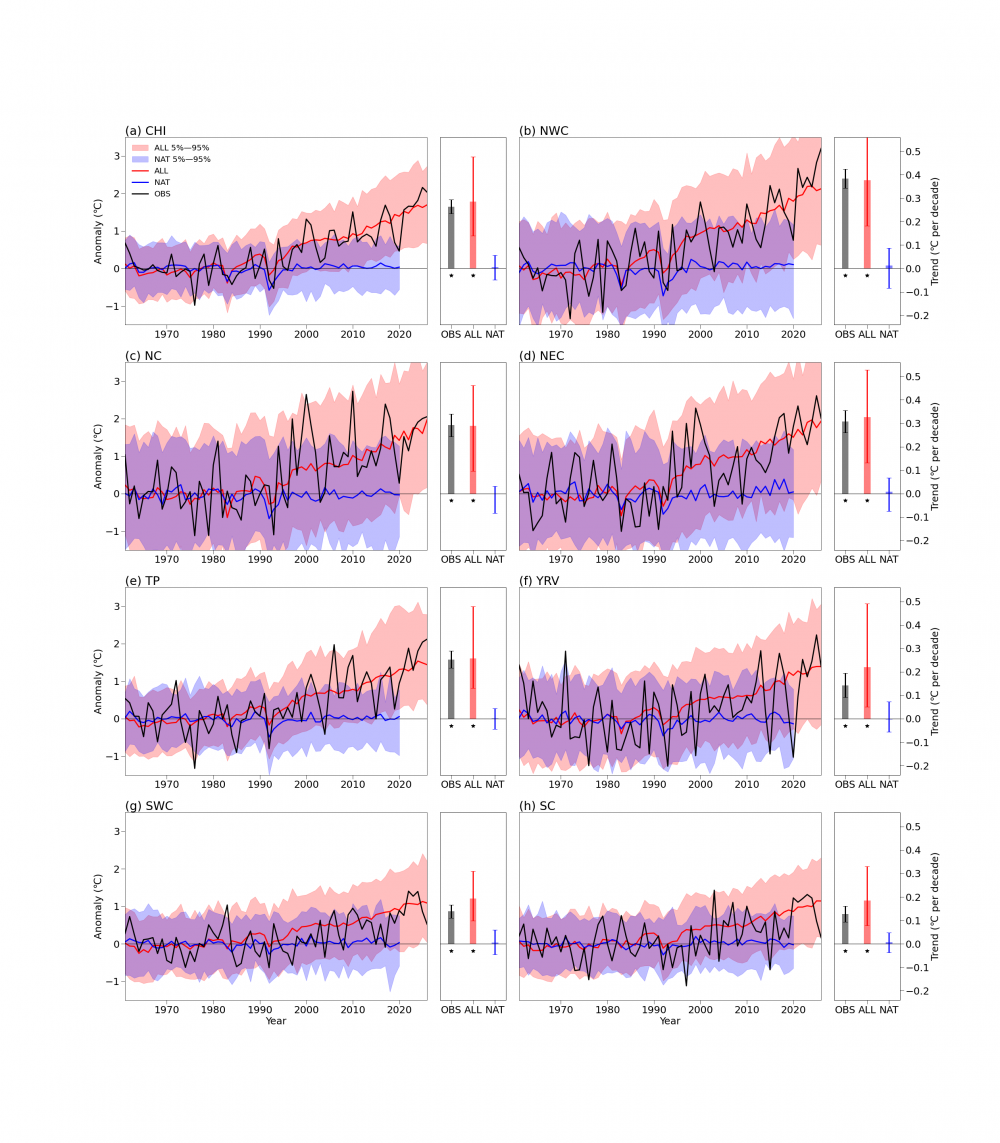
Figure 2. Left: Observed (OBS) and CMIP6-simulated (ALL: all-forcing; NAT: natural-forcing only) July mean temperature anomalies (relative to 1961–1990, °C) from 1961 to 2026 for China and its seven sub-regions. Shading indicates the 5%–95% multi-model ensemble range. Right: Corresponding warming trends (°C/decade). An asterisk (*) denotes significance at p < 0.05; vertical lines show 5%–95% confidence intervals. Region abbreviations: CHI (China), NWC (Northwest China), NC (North China), NEC (Northeast China), TP (Tibetan Plateau), YRV (Middle–Lower Yangtze River Valley), SWC (Southwest China), SC (South China).
Attribution Analysis
Attribution using CMIP6 models (Figs. 2 & 3) indicates that, under the current climate (2021–2031), human activities have increased the probability of July-2026-like extreme heat events by factors of 23.0 and 68.4 (90% CI: 18.4–30.3 and 49.6–101.2) for Northeast China and the Tibetan Plateau, respectively, while intensifying their magnitudes by 1.24°C and 1.07°C (1.20–1.27°C and 1.06–1.09°C). For North China, Northeast China, and the Middle–Lower Yangtze River Valley, anthropogenic influence raised the probability of such events by 4.3 (4.2–4.5), 5.0 (4.8–5.2), and 4.0 (3.9–4.1) times, with corresponding intensity enhancements of 1.17°C (1.14–1.19°C), 1.31°C (1.28–1.32°C), and 0.98°C (0.96–1.00°C). In Southwest China and South China, anthropogenic warming contributed 0.93°C (0.68–1.19°C) and 0.98°C (0.71–1.25°C), but internal climate variability and other factors lowered temperatures by 0.41°C (0.16–0.67°C) and 0.82°C (0.55–1.09°C), largely offsetting the human-induced signal.
These results imply that human activities have significantly raised the likelihood of record-breaking heat in Northwest China and the Tibetan Plateau—without anthropogenic influence, extremes of this magnitude would have been exceptionally rare. At the same time, anthropogenic forcing has clearly strengthened the intensity of heat events in North China, Northeast China, and the Middle–Lower Yangtze River Valley. In Southwest and South China, although anthropogenic warming does contribute, its effect is counterbalanced by internal variability, resulting in relatively modest observed warming.
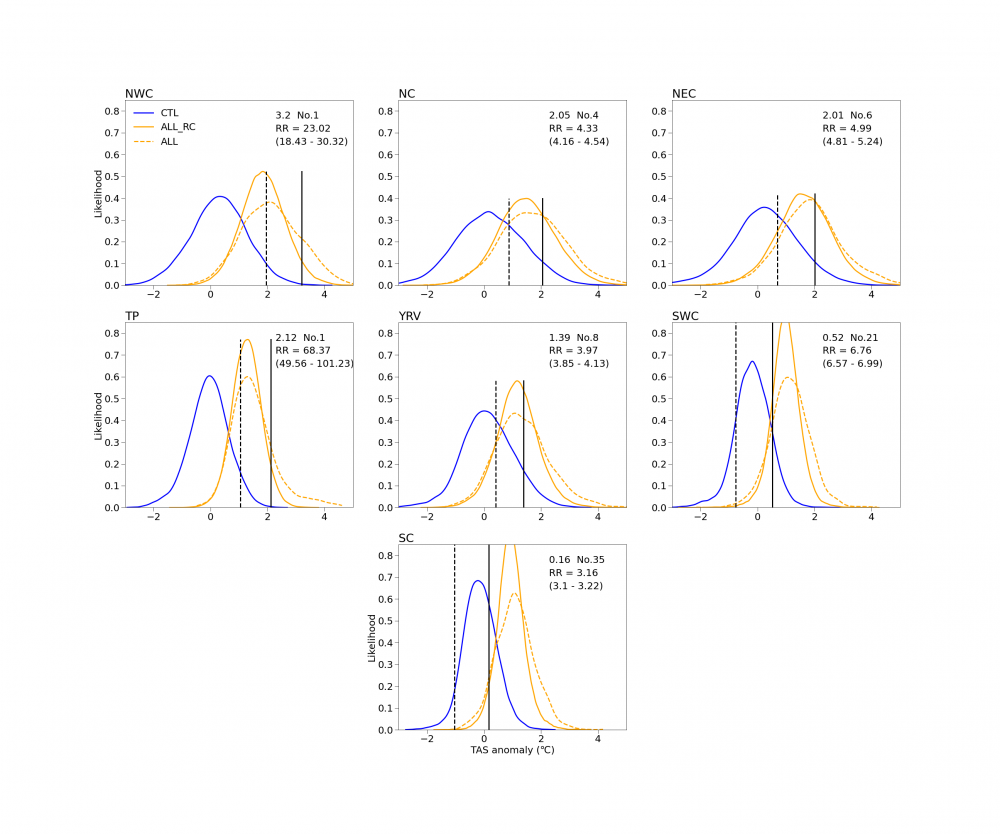
Figure 3. Human influence on the probability of July 2026 high-temperature anomalies across China’s seven regions. Solid blue and orange lines represent probability distributions under the current climate (2021–2031, 11-year window centred on 2026) for the pre-industrial control (CTL) experiments and the reconstructed ALL distribution (combining the adjusted anthropogenic forcing response with unforced internal variability), respectively. The orange dashed line shows the ALL-forcing distribution. Vertical lines mark the July 2026 threshold (black solid) and the CTL threshold corresponding to the same probability as the ALL experiment (black dashed). Upper-right labels show event intensity, historical ranking, risk ratio (RR) of human influence, and its 5%–95% confidence intervals (from 1000 bootstrap resamples).
Future Projections
Under the medium-emissions scenario (SSP2-4.5), CMIP6 multi-model projections (Fig. 4) indicate that over the next 5–10 years (2031–2036), the probability of July-2026-like extreme warmth in Northwest China and the Tibetan Plateau will rise substantially, with return periods of 11.7 years (11.3–12.2) and 8.3 years (8.1–8.6), respectively. For North China, Northeast China, and the Middle–Lower Yangtze River Valley, return periods are projected to be around 2 years—specifically 2.6 (2.6–2.7), 2.2 (2.1–2.2), and 2.1 (2.0–2.1) years. In Southwest and South China, 2026-like warm conditions will occur almost annually, whereas return periods for record-breaking July heat events will be 3.3 years (3.3–3.4) and 4.4 years (4.3–4.5).
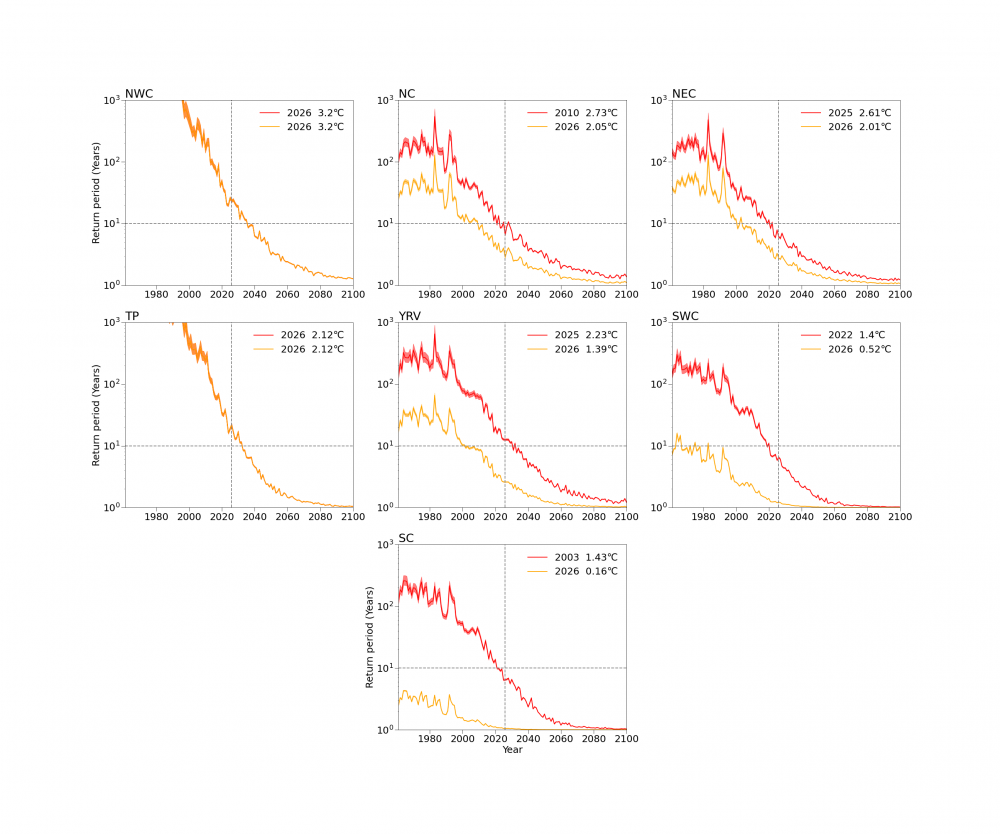
Figure 4. Changes in return periods for July high-temperature events in China’s seven regions from 1961 to 2100. Orange and red solid lines denote 2026-like and record-breaking events, respectively; shading indicates 5%–95% confidence intervals (from 1000 bootstrap resamples). Upper-right labels show event year and intensity.
Methodology
These results were obtained using the rapid attribution prototype for extreme high temperatures developed by the National Climate Centre. The prototype employs a CMIP6-based response-adjusted attribution method, integrating model output and observational data through preprocessing and model pre-evaluation to establish an optimised operational framework suitable for rapid attribution.
For further details, please refer to: Advances in Climate Change Research (https://www.sciencedirect.com/science/journal/16749278)